RoofingUnit Cost Benchmark
Roof Replacement Cost per Square Foot in 2026 (and per Roofing Square)
Roof replacement typically costs $3.75 to $11 per sq ft, with a U.S. national average of $4.75 per sq ft.
Cost snapshot
U.S. national figures ·
- Typical range
- $3.75 – $11
- per sq ft
- National average
- $4.75
- Full range
- $3 – $30
Where the typical range comes from: Fixr's published per-sq-ft range and average for roof replacement across materials (page updated February 4, 2026).
Roof replacement costs $3.75 to $11 per square foot installed, $4.75 on average, according to Fixr, or $375 to $1,100 per roofing square (100 sq ft). HomeAdvisor reports $4 to $11 (about $7 on average). Asphalt shingles sit at the low end: Fixr lists $3 to $5 for 3-tab and $4 to $8 for architectural, HomeGuide $3 to $6 for asphalt ($300 to $600 per square) and This Old House a $5.16 average. Other materials cost more: This Old House reports $13.15 for wood shake, $19.30 for metal and $22.21 for clay tile. The full range shown, $3 to $30, runs from 3-tab asphalt to copper and slate (Fixr, HomeGuide).
Overview
Roof Replacement Cost per Square Foot: Overview
Roof replacement costs $3.75 to $11 per sq ft, $4.75 on average (Fixr), or $375 to $1,100 per roofing square. Compare asphalt, metal, tile and wood prices.
These figures come from the published cost sources listed under Methodology & sources; figures we calculate are labeled. Setting a ZIP code or state adjusts only the labor share, using Bureau of Labor Statistics wage data.
| What it covers | Typical range | Basis |
|---|---|---|
| Installed project | $3.75 – $11per sq ftNational average: $4.75 per sq ft | Medium confidence; cited: Fixr, HomeAdvisor, HomeGuide, This Old House |
| Equipment or materials | $0.80 – $2.50per sq ft | Cited: HomeGuide |
| Labor | $2 – $3.50per sq ft | Cited: HomeGuide, HomeAdvisor, Fixr, This Old House |
By size
Cost by Roof Size & Scope
Roofing costs scale with roof area (measured in squares of 100 sq ft), pitch, and how much of the roof the project covers.
| Size or scope | Typical home coverage | Installed cost | Average | Source |
|---|---|---|---|---|
| 1,000 sq ft roof (10 squares) | Fixr's published range; average at Fixr's $4.75 per sq ft (calculated) | $3,750 – $11,000 | $4,750 | Fixr |
| 1,200 sq ft roof (12 squares) | Fixr's published range; average at Fixr's $4.75 per sq ft (calculated) | $4,500 – $13,200 | $5,700 | Fixr |
| 1,500 sq ft roof (15 squares) | Fixr's published range; average at Fixr's $4.75 per sq ft (calculated) | $5,625 – $16,500 | $7,125 | Fixr |
| 2,000 sq ft roof (20 squares) | Fixr's published range; average at Fixr's $4.75 per sq ft (calculated) | $7,500 – $22,000 | $9,500 | Fixr |
| 2,500 sq ft roof (25 squares) | Fixr's published range; average at Fixr's $4.75 per sq ft (calculated) | $9,375 – $27,500 | $11,875 | Fixr |
| 3,000 sq ft roof (30 squares) | Fixr's published range; average at Fixr's $4.75 per sq ft (calculated) | $11,250 – $33,000 | $14,250 | Fixr |
By type
Cost by Material & Method
| Type | What it involves | Typical cost |
|---|---|---|
| 3-Tab Asphalt ShinglesInstalled per sq ft | The most economical asphalt shingle. HomeGuide gives the same $3 to $5; HomeAdvisor lists a $1.50 starting price. | $3 – $5 (Fixr)HomeGuide, HomeAdvisor |
| Architectural Laminated ShinglesInstalled per sq ft | Thicker laminated shingles; the most common choice (Fixr). HomeAdvisor and HomeGuide list $4 to $6. | $4 – $8 (Fixr)HomeAdvisor, HomeGuide |
| Luxury / Designer Asphalt ShinglesInstalled per sq ft | Premium shingles with more color and texture. HomeGuide lists $5 to $7 and HomeAdvisor $9.50 for luxury synthetic shingles. | $6.50 – $16 (Fixr)HomeGuide, HomeAdvisor |
| All Roof Replacements (any material)Installed per sq ft | Fixr's overall per-sq-ft figure across materials. Fixr's average is $4.75; HomeAdvisor lists $4 to $11, about $7 on average. | $3.75 – $11 (Fixr)HomeAdvisor |
| Wood or Cedar ShakeInstalled per sq ft | Split or sawn wood. HomeGuide lists $7 to $15. | $13.15 avg. (This Old House)HomeGuide |
| Standing Seam MetalInstalled per sq ft | Concealed-fastener metal panels. HomeGuide lists $9 to $16. | $7 – $30 (HomeAdvisor)HomeGuide |
| Metal (all styles)Installed per sq ft | Steel, aluminum and other metals; see the metal roof guide for each metal. Fixr's average is about $11; This Old House reports $19.30 on average. | $3 – $30 (Fixr)This Old House |
| Concrete or Clay Tile (range)Installed per sq ft | Heavy tile roofing. HomeAdvisor lists concrete at $9 to $18 and clay at $8 to $25. | $8 – $25 (HomeAdvisor) |
| Clay TileInstalled per sq ft | Fired-clay tile. HomeAdvisor lists $8 to $25. | $22.21 avg. (This Old House)HomeAdvisor |
Breakdown
Parts vs. Labor Breakdown
What the equipment or materials cost compared with the installer's labor, and what each figure is based on.
Roofers (hours per roofing square)
- Labor range
- $2 – $3.50
- Planning estimate of on-site hours
- 2.7 – 4.7 hrs
- BLS median employee wage
- $26.65/hr
- Equipment or materials: $0.80 – $2.50
- Asphalt shingle materials only: HomeGuide lists $80 to $130 per roofing square for 3-tab and $100 to $250 for architectural shingles, or $0.80 to $2.50 per sq ft. Metal, tile and slate materials cost more; see the cost by type table.
- Labor: $2 – $3.50
- Shingle installation labor: HomeGuide lists $2.00 to $3.50 per sq ft ($200 to $350 per roofing square), not including materials, and $4 to $8 per sq ft for metal. HomeAdvisor gives $1.50 to $4 per sq ft and about 60% of the cost; Fixr puts asphalt labor at 50% to 60% ($1.50 to $9.60 per sq ft). Hours are per roofing square and calculated ($200 to $350 divided by This Old House's $75 per hour). Benchmark: BLS reports a May 2025 national median wage of $26.65 per hour for roofers, which is an employee wage, not a contractor rate.
BLS reports what employees earn, not what contractors bill; contractor rates also cover insurance, vehicles, overhead and profit. We use the BLS wage only to adjust the labor share for your location.
Extras
Additional Line Items Often Needed
| Item | Typical added cost | Needed? | Notes |
|---|---|---|---|
| Existing Shingle Tear-Off and Disposal | $50 – $150 per square (Fixr)HomeGuide, HomeAdvisor | Common | Often included in the quote; these are the prices when tear-off and disposal are billed separately. HomeGuide lists $1 to $3 per sq ft for shingles and HomeAdvisor $1 to $5 per sq ft. |
| Roof Decking Replacement | $2 – $8 per sq ft (Fixr)HomeGuide | As Needed | Billed only for rotted areas found after tear-off; see our roof decking guide. HomeGuide lists $2 to $5. |
| Ice and Water Shield | About $0.50 per sq ft (Fixr) | Common | Often required along the eaves in cold climates. Roughly $50 per roofing square. |
| Re-Roofing Permit | $100 – $500 (Fixr)HomeGuide | Required | A per-project fee, not part of the per-sq-ft price. Per project; HomeGuide gives the same range. |
Calculator
Roof Cost Per Square Foot Estimator
Choose the options closest to your project for a planning range. It is not a quote; compare it with written, itemized proposals.
1Roof surface area
2Roofing material
A ZIP code scales the labor share of the estimate (about 55%) by the BLS wage ratio for the trade.
About $3.75 – $11 per sq ft for 2,000 sq ft
National planning estimate. Not a quote.
- Roof surface area: 2,000 sq ft (20 squares)
- $7,500 – $22,000
- Roofing material
- Any material
- Location
- National
A ZIP code or state changes only the labor share of the estimate, using the BLS Occupational Employment and Wage Statistics (May 2025) wage ratio for the trade. Materials, equipment and permits stay at national figures. Planning estimates, not contractor quotes.
The result is a project total: the roof area times the installed price per sq ft. The price per sq ft is shown under it.
Area options match the rows on this page (Fixr's $3.75 to $11 per sq ft across materials); the shingle options use Fixr's installed prices.
The steep-roof add-on is This Old House's $1,000 to $3,000 surcharge; tear-off billed separately is Fixr's $50 to $150 per square (100 sq ft).
Rotted decking is extra ($2 to $8 per sq ft, Fixr).
Location
Personalize This Estimate by ZIP or State
A ZIP code or state changes only the labor share of this guide's range (about 55%), using BLS wage data for the trade. Materials, equipment and permits stay at national figures. Results are estimates, not contractor quotes.
National figures: typical $3.75 – $11 per sq ft, average $4.75.
Leave empty for national figures.
$4.75per sq ft
National average $4.75 · no location applied
- Typical range
- $3.75 – $11
- Full project range
- $3 – $30
- Labor index (BLS wage ratio)
- 1.00×
- Materials, equipment, permits
- National (not adjusted)
$2 – $3.50
National labor band. Hourly rate cited in this guide: $30–$100/hr (national).
$0.80 – $2.50
This guide's national allowance (see its sources); not adjusted by location.
Permits and inspections
This guide does not price a permit. Rules are set by each city or county; ask the contractor whether one is needed and who pulls it.
Typical range in all 50 states and DC
Modeled, not published by a source: the national typical range with the labor share (about 55%) scaled by each state's BLS Occupational Employment and Wage Statistics (May 2025) mean wage for roofers, divided by the national mean of $27.95/hr. Materials, equipment and permits stay national.
| State | BLS mean wage | Labor index | Typical range (per sq ft) | Average | Action |
|---|---|---|---|---|---|
| Alabama | $23.01/hr | 0.82× | $3.38 – $9.93 | $4.29 | |
| Alaska | $32.91/hr | 1.18× | $4.12 – $12.07 | $5.21 | |
| Arizona | $24.33/hr | 0.87× | $3.48 – $10.21 | $4.41 | |
| Arkansas | $22.01/hr | 0.79× | $3.31 – $9.71 | $4.19 | |
| California | $32.41/hr | 1.16× | $4.08 – $11.97 | $5.17 | |
| Colorado | $27.01/hr | 0.97× | $3.68 – $10.79 | $4.66 | |
| Connecticut | $32.93/hr | 1.18× | $4.12 – $12.08 | $5.22 | |
| Delaware | $26.58/hr | 0.95× | $3.65 – $10.70 | $4.62 | |
| District of Columbia | $33.05/hr | 1.18× | $4.13 – $12.10 | $5.23 | |
| Florida | $23.49/hr | 0.84× | $3.42 – $10.03 | $4.33 | |
| Georgia | $23.29/hr | 0.83× | $3.41 – $9.99 | $4.31 | |
| Hawaii | $29.53/hr | 1.06× | $3.87 – $11.34 | $4.90 | |
| Idaho | $26.11/hr | 0.93× | $3.61 – $10.60 | $4.58 | |
| Illinois | $37.33/hr | 1.34× | $4.44 – $13.03 | $5.63 | |
| Indiana | $28.75/hr | 1.03× | $3.81 – $11.17 | $4.83 | |
| Iowa | $25.04/hr | 0.90× | $3.54 – $10.37 | $4.48 | |
| Kansas | $25.66/hr | 0.92× | $3.58 – $10.50 | $4.54 | |
| Kentucky | $24.37/hr | 0.87× | $3.49 – $10.23 | $4.42 | |
| Louisiana | $25.38/hr | 0.91× | $3.56 – $10.44 | $4.51 | |
| Maine | $25.82/hr | 0.92× | $3.59 – $10.54 | $4.55 | |
| Maryland | $29.63/hr | 1.06× | $3.87 – $11.36 | $4.91 | |
| Massachusetts | $35.09/hr | 1.25× | $4.28 – $12.54 | $5.42 | |
| Michigan | $29.54/hr | 1.06× | $3.87 – $11.34 | $4.90 | |
| Minnesota | $35.06/hr | 1.25× | $4.27 – $12.54 | $5.41 | |
| Mississippi | $21.77/hr | 0.78× | $3.29 – $9.66 | $4.17 | |
| Missouri | $27.08/hr | 0.97× | $3.69 – $10.81 | $4.67 | |
| Montana | $27.41/hr | 0.98× | $3.71 – $10.89 | $4.70 | |
| Nebraska | $23.04/hr | 0.82× | $3.39 – $9.94 | $4.29 | |
| Nevada | $27.62/hr | 0.99× | $3.73 – $10.93 | $4.72 | |
| New Hampshire | $30.69/hr | 1.10× | $3.95 – $11.59 | $5.01 | |
| New Jersey | $35.76/hr | 1.28× | $4.33 – $12.69 | $5.48 | |
| New Mexico | $23.07/hr | 0.82× | $3.39 – $9.94 | $4.29 | |
| New York | $33.34/hr | 1.19× | $4.15 – $12.17 | $5.25 | |
| North Carolina | $24.06/hr | 0.86× | $3.46 – $10.16 | $4.39 | |
| North Dakota | $29.11/hr | 1.04× | $3.84 – $11.25 | $4.86 | |
| Ohio | $26.76/hr | 0.96× | $3.66 – $10.74 | $4.64 | |
| Oklahoma | $23.61/hr | 0.84× | $3.43 – $10.06 | $4.34 | |
| Oregon | $29.57/hr | 1.06× | $3.87 – $11.35 | $4.90 | |
| Pennsylvania | $27.15/hr | 0.97× | $3.69 – $10.82 | $4.67 | |
| Rhode Island | $30.57/hr | 1.09× | $3.94 – $11.57 | $5 | |
| South Carolina | $24.13/hr | 0.86× | $3.47 – $10.17 | $4.39 | |
| South Dakota | $22.59/hr | 0.81× | $3.35 – $9.84 | $4.25 | |
| Tennessee | $22.47/hr | 0.80× | $3.35 – $9.81 | $4.24 | |
| Texas | $22.69/hr | 0.81× | $3.36 – $9.86 | $4.26 | |
| Utah | $24.80/hr | 0.89× | $3.52 – $10.32 | $4.45 | |
| Vermont | $27.08/hr | 0.97× | $3.69 – $10.81 | $4.67 | |
| Virginia | $24.77/hr | 0.89× | $3.51 – $10.31 | $4.45 | |
| Washington | $33.11/hr | 1.19× | $4.13 – $12.12 | $5.23 | |
| West Virginia | $24.56/hr | 0.88× | $3.50 – $10.27 | $4.43 | |
| Wisconsin | $27.91/hr | 1.00× | $3.75 – $10.99 | $4.75 | |
| Wyoming | $23.89/hr | 0.85× | $3.45 – $10.12 | $4.37 |
Regional figures use only U.S. Bureau of Labor Statistics Occupational Employment and Wage Statistics (May 2025) for the trade: the mean wage in the state, or in one of eight large cities for ZIP codes inside them, divided by the national mean. ZIP codes outside the 50 states and DC use national figures.
Anatomy
How Roof Area Is Measured: Every Plane Counted in Squares
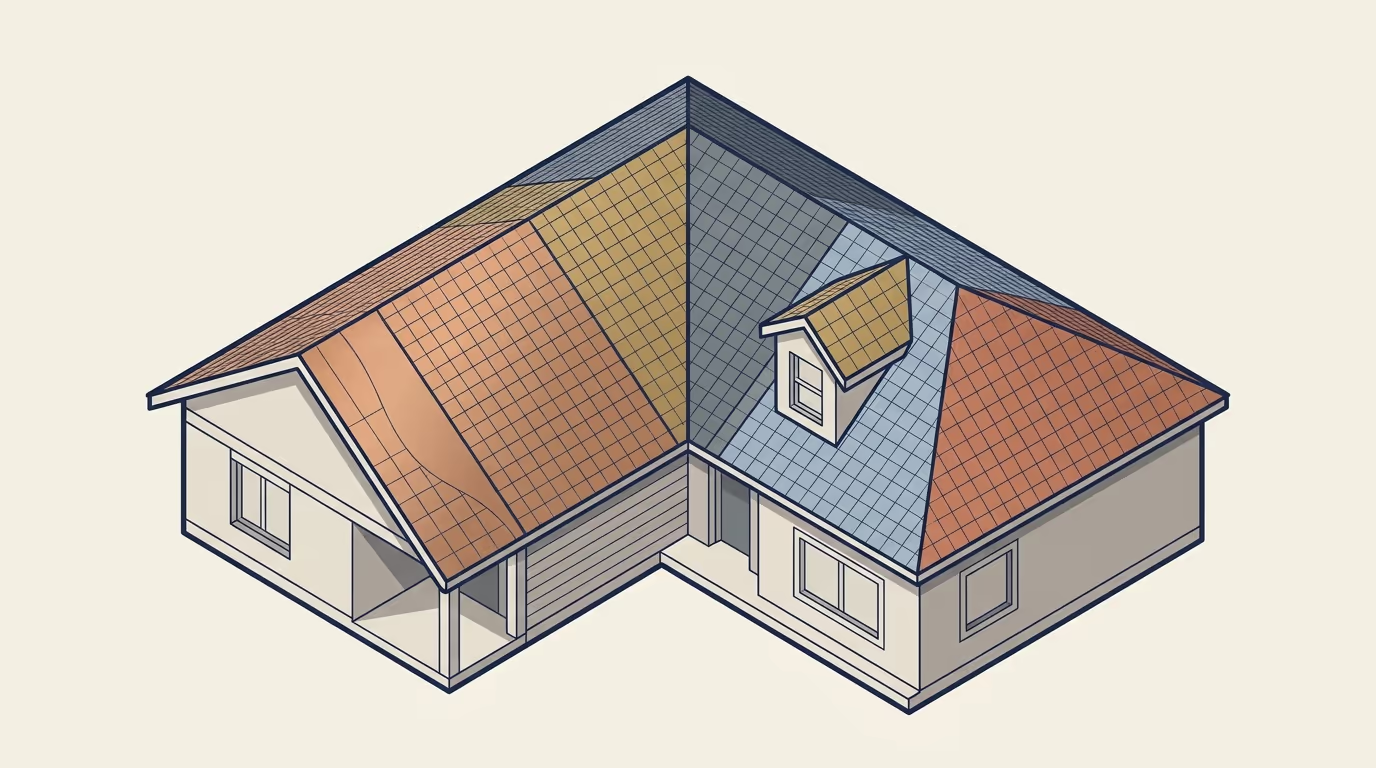
Part 1: Roofing square
Roofers price by the square: 100 sq ft of roof surface. A price per sq ft times 100 gives the price per square.
Part 2: Roof area vs. floor area
Roof area is larger than the home’s footprint because of the overhangs and the slope; a steeper roof has more surface over the same footprint.
Part 3: Hips, valleys and dormers
Every extra plane and intersection adds cutting, flashing and waste, which raises the price per square foot compared with a simple gable roof.
Part 4: Waste allowance
Material orders include extra for cuts and waste, and more of it on complex roofs.
Market
Input Price Changes: Last 12 Months
Contractor quotes move with the cost of materials, equipment, and labor. The chart shows how official U.S. Bureau of Labor Statistics (BLS) price and wage series changed between Aug 25 and Aug 26. These are national input indices, not the price of this project, and they are not a forecast.
| BLS series | Aug 25 | Aug 26 | 12-month change |
|---|---|---|---|
| Asphalt shingle and coating materials manufacturing (PPI) (opens in a new tab) | 360.462 | 377.534 | +4.7% |
| Plywood (PPI) (opens in a new tab) | 271.138 | 300.124 | +10.7% |
| Average hourly earnings, specialty trade contractors (production and nonsupervisory) (opens in a new tab) | 37.02 | 38.94 | +5.2% |
Source: U.S. Bureau of Labor Statistics, Producer Price Index and Current Employment Statistics, retrieved 2026-10-08. Recent months are preliminary and can be revised for up to four months. Price indices are not seasonally adjusted. Each line is the percentage change from Aug 25.
Quote check
Is Your Quote in the Typical Range?
Enter a written estimate to see where it falls against this guide's planning range for your labor market.
Within the typical range
Your quote: $4.75 per sq ft
$3.75 – $11per sq ft
Average $4.75
Within the typical range. Quotes inside this range still differ with equipment, scope, access and warranty; compare itemized quotes line by line.
Getting comparable quotes
- Ask each contractor to price materials, labor, permits, disposal and optional work separately.
- Confirm the scope, equipment model, warranty, schedule and exclusions in writing.
- Compare like-for-like proposals from licensed, insured local contractors. Repair Cost Atlas does not match homeowners with contractors.
Direct answers
Frequently Asked Questions: Roof Replacement Cost per Square Foot
Short, plain answers to the questions homeowners ask before contacting a contractor.
Fixr reports $3.75 to $11 per sq ft installed for roof replacement, $4.75 on average, and HomeAdvisor $4 to $11 (about $7 on average). A roofing square is 100 sq ft, so Fixr's range is $375 to $1,100 per square. For asphalt shingles, Fixr lists $3 to $5 for 3-tab and $4 to $8 for architectural, HomeGuide $3 to $6 ($300 to $600 per square) and This Old House a $5.16 average.
This Old House reports average installed prices of $5.16 per sq ft for asphalt shingles, $13.15 for wood shake, $19.30 for metal and $22.21 for clay tile. HomeAdvisor lists $7 to $30 for standing seam metal, $9 to $18 for concrete tile and $8 to $25 for clay tile. Fixr's overall figure for roof replacement is $4.75 per sq ft on average within $3.75 to $11.
HomeGuide lists labor at $2.00 to $3.50 per sq ft ($200 to $350 per roofing square) to install shingles and $4 to $8 per sq ft for metal, not including materials. HomeAdvisor gives $1.50 to $4 per sq ft for shingle labor, and Fixr $1.50 to $9.60 per sq ft, or 50% to 60% of an asphalt roof. This Old House puts labor at about 65% of project costs. See the asphalt shingle guide for labor per square by shingle type.
In the roofing trade, a "square" is a unit of measurement equal to 100 square feet of roof surface area. A 2,000 square foot roof requires 20 squares of shingles, plus 10–15% extra for waste, valley cuts, and starter courses.
Roof area is larger than floor area because of the slope and overhangs; HomeGuide says a pitched roof is typically 15% to 40% larger than the floor. Fixr pairs a 1,000 sq ft house with about 1,200 sq ft of roof, a 1,500 sq ft house with 1,800, a 2,000 sq ft house with 2,400 and a 3,000 sq ft house with 3,600. Multiply the roof area by the per-sq-ft price: for example, 1,800 sq ft of roof at Fixr's $3.75 to $11 is $6,750 to $19,800 (calculated).
The sources define the roof differently. HomeAdvisor lists architectural shingles at $4 to $6 on its roof replacement page and a $3.50 starting price on its shingle page, Fixr lists $4 to $8 and HomeGuide $4 to $6, while Angi's $1 to $3 for architectural shingles is material only. Angi and HomeAdvisor belong to the same company, so they count as one source. Prices also depend on roof size, pitch, and whether tear-off is included.
Sometimes. Fixr lists roof repairs at $3.50 to $11 per sq ft on average ($350 to $1,100 per square), but small repairs are usually priced per job. See our roof repair cost guide for prices by repair type.
Most roofs are asphalt shingles, which cost $3 to $8 per sq ft installed (Fixr), while metal, tile and slate stretch the top of the range: Fixr lists metal at $3 to $30 and This Old House reports $22.21 for clay tile. That pulls Fixr's $3.75 to $11 range upward but leaves its $4.75 average near the bottom. HomeAdvisor's average is higher, about $7. Much higher whole-roof reports are explained in our roof replacement guide.
Evidence
What supports these figures?
Each figure on this page and the published sources it is credited to. “Use with caution” marks figures we could not match to a published price. Wage, equipment and code references support only that narrower point, not an installed price.
| Estimate | Range or value | Published sources | Status |
|---|---|---|---|
| Published installed prices for asphalt shingles are $3 to $5 (3-tab) and $4 to $8 (architectural) per sq ft per Fixr, and $4 to $6 for architectural per HomeAdvisor. | $3 – $8/sq ft installed | Fixr (opens in a new tab)Angi (HomeAdvisor) (opens in a new tab) | Source reviewed |
| Fixr reports $4.75 per sq ft on average within $3.75 to $11 for roof replacement, and HomeAdvisor $4 to $11 (about $7); This Old House reports a $5.16 per sq ft average for asphalt shingles. | $3.75 – $11 per sq ft | Fixr (opens in a new tab)Angi (HomeAdvisor) (opens in a new tab)This Old House (opens in a new tab) | Source reviewed |
| HomeAdvisor lists $7 to $30 per sq ft for standing seam and $8 to $25 for tile. | $7 – $30/sq ft | Angi (HomeAdvisor) (opens in a new tab) | Source reviewed |
| This Old House reports average installed prices of $13.15 per sq ft for wood shake, $19.30 for metal and $22.21 for clay tile on a 2,000 sq ft roof. | $13.15 – $22.21 per sq ft | This Old House (opens in a new tab) | Source reviewed |
Sources
Methodology & Data Sources
The typical range and average come from the cost publishers listed below; we compare what they publish and label figures we calculate ourselves. Bureau of Labor Statistics (BLS) wage data adjusts only the labor share when you set a ZIP code or state. Technical references support specifications, not prices.
Cost publishers · 4 independent (13 pages)
- 1.
- 2.
- 3.
- 4.
- 5.
- 6.
- 7.
- 8.
- 9.
- 10.
- 11.
- 12.
- 13.
Wage data and technical references
What changed
- Typical range re-based on Fixr's published $3.75 to $11 per sq ft with its $4.75 average; the previous $3.50 low bound and $5 average were not a published range. Size table now Fixr's published prices by roof size. Materials and labor per sq ft now HomeGuide's published shingle prices instead of a modeled split.